
Why we wrote this
Only about 1.5% of the roughly 20,000 games released on Steam in 2025 crossed $1 million in revenue. The median game grossed $249, $174 after Valve's cut.
Most of the rest didn't fail on effort. They watched concurrent players and total wishlist count, the easiest numbers to check. Wishlist velocity, page conversion rate, and traffic source quality, the numbers that actually predict a sale, went unmeasured until launch week.
This guide exists to fix that sequence:
- What actually predicts sales, and what doesn't (Stage 1)
- How to close the gap in what Steamworks shows you (Stage 2)
- How to read your prelaunch signals correctly, before launch (Stage 3)
I hope it helps you catch a bad trajectory while there's still time to change it.
Robbie Ferguson, Co-Founder and President at Immutable

P.S.
We built Immutable to close exactly the gap this guide describes: the distance between the data Steam gives you and the data you actually need to run a launch. Ubisoft used Immutable's Conversion Funnel and Engage to lift Day 1 player conversion from 2.37% to 6.64%, a 2.8x increase, on Might & Magic: Fates. Book a demo to see what closing that gap could look like for your launch.
Stage 1: Know What Actually Predicts Sales
Concurrent player count is the most-watched number on a Steam page. It's also one of the least predictive. Some games that go on to sell hundreds of thousands of copies never show it.
1. Stop Watching CCU
Concurrent players (CCU) measures how many people are playing a game at the same moment. For single-player and short indie titles, the bulk of what launches on Steam, it says almost nothing about revenue. It tracks social visibility for multiplayer games well. It doesn't track much else.
| Title | Peak CCU | Outcome |
|---|---|---|
| A Short Hike | 230 | ~300,000 units sold |
| theHunter: Call of the Wild | 7,000-8,000 | $100M+ Steam revenue, top-100 all-time grossing |
| Manor Lords | ~5,000 (post-launch) | $60M revenue, 250,000 copies/month |
| Baldur's Gate 3 | ~75,000 (Early Access) | 15M+ copies sold, ~$1B gross |
None of these games would have looked healthy on a CCU chart at the point their revenue was strongest.
Key insight: CCU survives because it's easy, not because it's accurate
CCU persists as a watched metric because it's the number that's easiest to glance at, not because it predicts anything.
There's also no defensible formula for converting CCU into a sales estimate: public calculators that try assume playtime and session patterns that vary too much by genre to generalize. The three metrics that do predict sales, wishlist velocity, page conversion rate, and traffic source quality, are covered in Step 3.
2. Decode Your Steam Page Analytics
Steamworks Traffic Reporting tells you how many people saw and visited your page. It does not tell you whether Steam is promoting it, and conflating the two is the most common mistake in reading this data.
Read your traffic numbers
Steamworks reports four things:
- Impressions
- Visits
- Click-through rate
- Traffic-source breakdown
An impression is your game's brand being displayed to a customer, not proof anyone looked at it. A visit is one load of your store page, and the same customer can generate several.
The median Steam page converts 8 to 12% of visitors into wishlisters during the Coming Soon phase, and 2 to 5% into buyers after launch, at full price. Moving from 8% to 12% wishlist conversion across 100,000 visits adds 4,000 wishlists. At a 15% wishlist-to-purchase rate and a $14.99 price, that's roughly $9,000 in extra launch revenue.
Note: Steamworks traffic data has coverage gaps
Reporting starts September 23, 2014, adds regional and ownership data from October 17, 2018, adds direct-navigation data from April 17, 2019, and excludes cookie-opted-out users since March 23, 2021.
What actually moves the algorithm
Store-page traffic and purchase conversion rate are not visibility-ranking factors, according to Valve's own documentation. They diagnose your marketing and your page; they are not inputs to how often Steam shows your game to new people.
Wishlists work the same way: Valve says wishlists are generally not a factor in algorithmic visibility either, with one named exception, Popular Upcoming. What Valve does say moves visibility is what happens after someone buys. Purchases and play are strong signals that can expose a game to more customers, and tags and player relevance shape personalized discovery.
Review score works as a gate rather than a lever: it isn't a visibility factor while a game sits at Mixed or better. But below 40% positive, the game becomes less likely to be featured.
Key insight: "improves your funnel" and "feeds the algorithm" are different claims
Wishlist velocity and traffic quality (Step 3) still matter, but as sales predictors and marketing diagnostics, not as algorithm levers. Conflating the two is one of the most common category errors in Steam marketing advice.
There's also no universal "good" Steam click-through rate. CTR comparisons break down for three reasons:
- Placement mix changes what's even measurable
- Some impressions can't produce a click at all
- A successful game can show a lower aggregate CTR simply because Steam is showing it to a much wider audience
Benchmark a placement against its own history, not a cross-Steam number.
3. Track Your Three Predictive Signals
Three signals predict a Steam launch's sales, observationally: wishlist velocity, page conversion rate, and traffic source quality. None is a published Valve algorithm factor; they predict sales, not visibility.
Wishlist velocity is the rate wishlists accumulate, not the running total. A game with 50,000 wishlists built up over eight years is averaging roughly 120 a week; one with 5,000 built up over six months is closer to 190 a week. The smaller total carries the stronger signal, and the two will perform very differently at launch. Sustained additions of 200 to 300 wishlists a week without active marketing is a strong signal on its own. And velocity right before launch predicts more than the total count does.
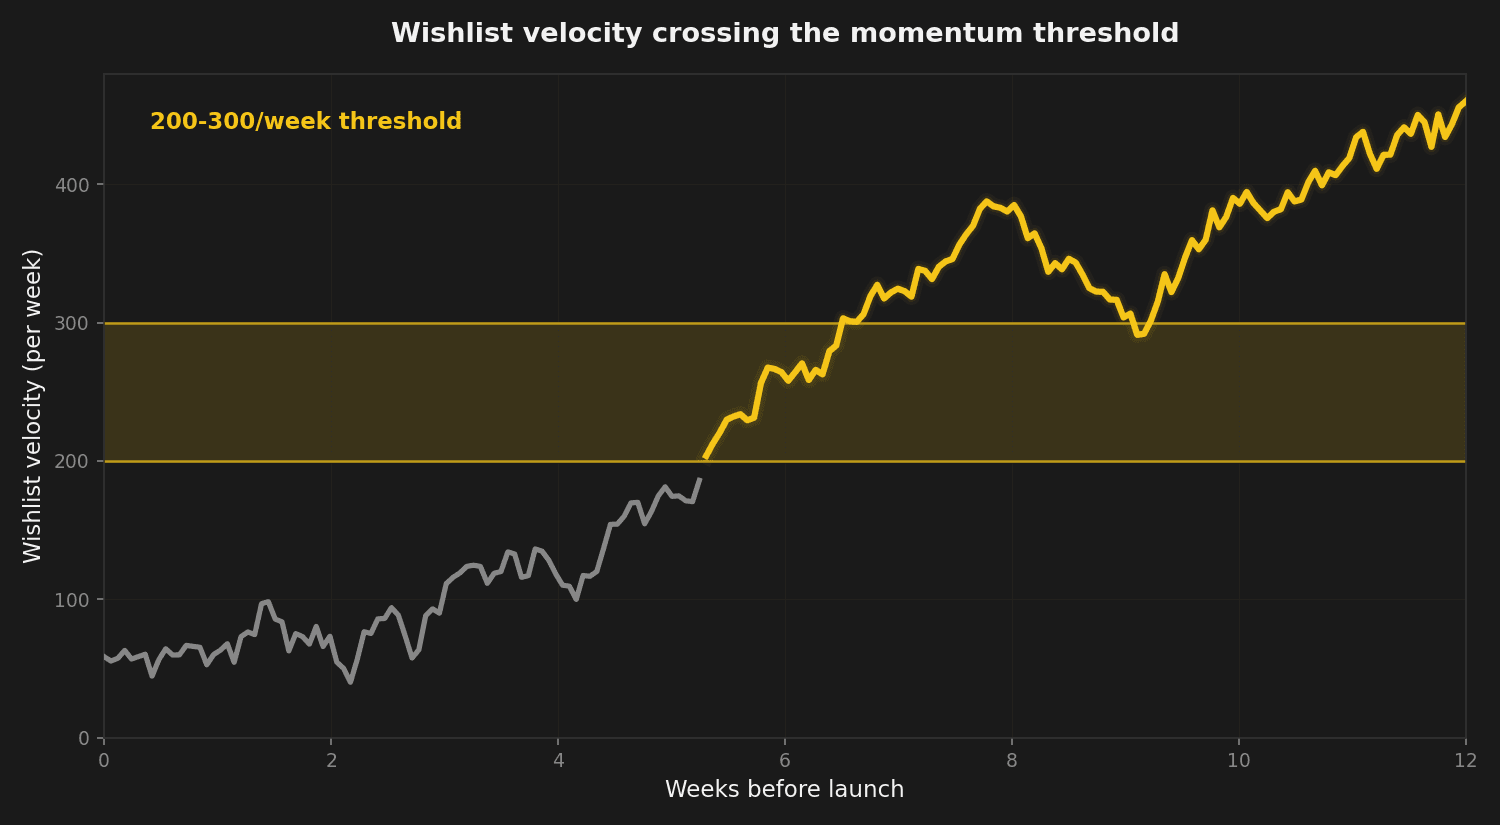
Public Steam follower counts can estimate a competitor's private wishlist balance. A 2023 survey of more than 125 unreleased Steam games found wishlist balance running 7 to 20 times follower count, 12x at the median, varying by genre:
- Turn-based strategy sits closer to 9x
- Story-rich games sit closer to 13.2x
- Puzzle games sit closer to 15.9x
Treat 12x as a starting estimate, not a fixed rule.
First-time player completion, the share of players who make it through a demo or playtest's opening, is the second signal. Below 70% completion signals an onboarding problem worth fixing before scaling acquisition.
Traffic source quality is the third: organic Steam-discovery wishlists convert 2 to 4 times better than wishlists from a paid campaign. So the same wishlist total can represent very different amounts of real intent depending on where it came from.
Key takeaways
- CCU tells you almost nothing about revenue for single-player and short titles; track wishlist velocity, page conversion, and traffic quality instead
- Store traffic, purchase conversion, and (outside Popular Upcoming) wishlists don't move Steam's algorithm; purchases, play, and a review score above 40% positive do
- Wishlist velocity right before launch predicts more than total wishlist count
- A first-time-player completion rate under 70% signals an onboarding problem to fix before spending more on acquisition
- Organic wishlists convert 2 to 4 times better than paid ones, so where a wishlist came from matters as much as the total
Stage 2: Fix the Data You're Missing
Once a player leaves your store page, Valve stops watching. Specifically, Steamworks reports nothing about whether they installed the game, how long they played, or whether they came back.
4. Know What Steamworks Gives You (and Hides)
Steamworks reports store-side numbers well and post-install behavior not at all. Steamworks reports:
- Impressions, visits, and click-through rate
- Traffic-source breakdown
- Wishlist adds, purchases, and activations
- UTM click tracking
It does not report:
- Install tracking
- Post-install session data: time played, return visits, retention
- Postbacks to ad platforms (Meta, Google, TikTok)
- API access to your own impressions and visits data
- Individual player-level data across channels
Accessing marketing traffic data requires the "View Marketing Traffic Data" permission. Data updates hourly, and CSV export is available.
Warning: demo and playtest conversions don't count the way you'd expect
Demo or DLC downloads without a base-game purchase don't count as conversions in Steamworks reporting, and playtest apps don't report conversions at all.
Two 2026 changes close part of this gap. Steam launched a Wishlist Data API in March 2026, giving programmatic access to wishlist adds, deletes, purchases, and gifts, a real upgrade for studios building their own dashboards. Sales & Activation remains the only authoritative source for your own title's units, revenue, and geographic data. Don't substitute SteamDB, SteamSpy, Gamalytic, or VG Insights for your own numbers, since those tools estimate and Steamworks reports.
Pro Tip: read refund reasons, don't just count refunds
Refund reporting exposes customer-stated reasons alongside the numbers. Investigate a high-refund period by build, version, and region using those reasons, not against an unsourced "industry average" refund rate, because none is publicly defensible.
Closing this blind spot needs third-party telemetry, covered in Step 6, along with definitions for DAU/MAU, D1/D7/D30 retention, and session length, since that's where the data actually originates.
5. Close the Attribution Black Hole
Steam's UTM tracking is aggregate and incomplete by design. That's not proof your campaign failed; it's how the system works.
Steamworks UTM Analytics accepts five parameters:
- utm_source
- utm_campaign
- utm_medium
- utm_content
- utm_term
It attributes wishlist, purchase, and activation conversions for a tracked visit within a 72-hour window. Valve's own documentation states the limit plainly: "If a player switches browsers or launches the Steam client and searches for the game, we have no way to associate their actions."
The UTM attribution gap is measurable. For example, a Green Man Gaming case study found only 24% of actual wishlists were attributed in Steam's UTM dashboard for one campaign. The reported cost per wishlist showed £3.30 against a real cost of £1.71: the dashboard overstated the cost by roughly 2x. Industry experience puts Steam UTM attribution at 20 to 30% of real traffic captured, driven by:
- Browser limitations
- Cross-device friction
- The halo effect (someone sees an ad, then searches for the game later)
- Cookie-consent declines
Key insight: a bad-looking campaign might be working
A campaign that looks like it's failing on the dashboard, with a high reported cost-per-wishlist, may actually be performing well. Your real cost-per-wishlist is likely 2x to 4x lower than the dashboard shows; divide the reported figure accordingly before judging the channel.
Two more limits matter for how you use this data. UTM reports finalize four days after a visit and don't later adjust the reported conversion count for refunds that happen after that. So treat UTM as a marketing-quality signal, never your financial ledger; Sales & Activation is the ledger. Steam also discontinued its old Google Analytics integration when Universal Analytics ended in July 2023, so Firebase or GA can't simply be dropped onto a store page as a replacement.
There's no defensible universal cost-per-wishlist benchmark, so calculate your own break-even instead:
Break-even CPW = incremental sale probability per paid wishlist × net contribution per sale
A studio estimating £10 contribution per sale and a 5% incremental paid-wishlist-to-sale probability gets £10 × 0.05 = £0.50 as a theoretical break-even cost per wishlist. A practical target should sit below that, since attribution is incomplete and the conversion assumption is uncertain.
6. Build Your Game Analytics Stack
Instrument in the right order, and mostly for free. The correct sequence:
- Session and onboarding telemetry, before public playtests
- Level-funnel events, before Early Access
- Full attribution setup, before any paid spend
At minimum, instrument this demo funnel:
- demo_start
- tutorial_start, tutorial_complete
- core_loop_start, core_loop_complete
- level_start, level_fail, level_complete
- demo_complete
- steam_cta_view, steam_cta_click
- session_end, plus build version
The number to watch from that funnel is core-loop completion: the share of demo players who reach core_loop_complete. That's the fraction of players who experienced the thing that makes the game worth buying, not a download count.
Start free
Free tiers cover most indie needs:
| Tool | Free tier |
|---|---|
| GameAnalytics AnalyticsIQ | Free, no MAU cap (Pro from $29/month) |
| Unity Gaming Services | First 50,000 analytics MAU free |
| PostHog | First 1M events/month free |
| Amplitude | First 2M events/month free |
| Mixpanel | First 1M events/month free |
Microsoft PlayFab exists for later-stage, backend-heavy needs (Standard $99/month, Premium $1,999/month), but it's not a first telemetry pick for a prelaunch indie team. Start narrow: instrument events with "hard, undeniable insight" only, and remove events quarterly that never informed a decision.
Read retention benchmarks correctly
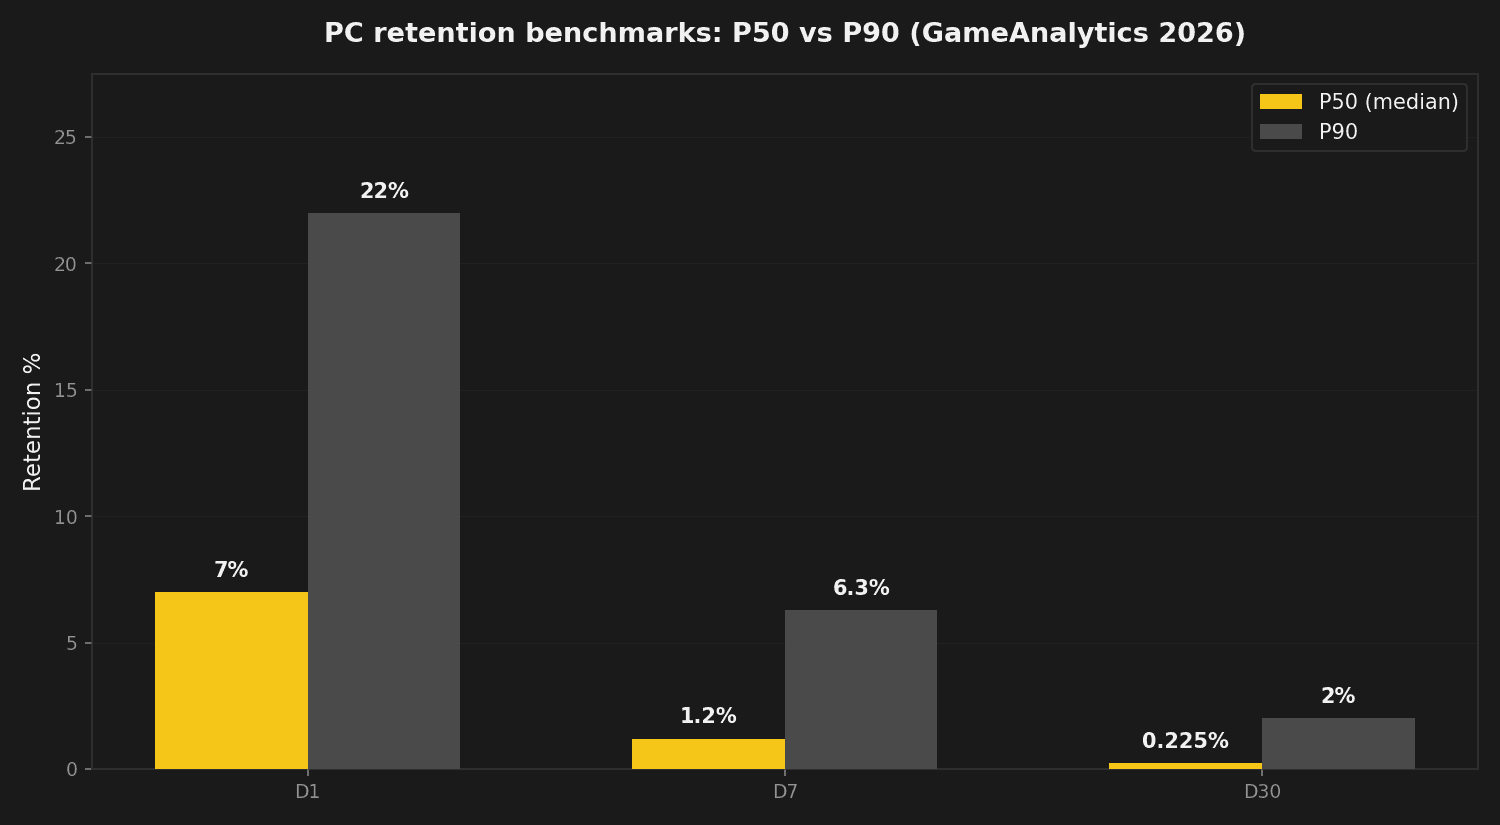
GameAnalytics' 2026 report, covering 3,582 PC games with at least 100 MAU and four months of live 2025 data, gives the clearest current picture of PC retention:
| Metric | P50 | P75 | P90 | P99 |
|---|---|---|---|---|
| D1 retention | ~7% | 12-13% | 21-23% | 40-50% |
| D7 retention | 1.1-1.3% | 2.7-3.2% | 5.8-6.9% | 18-27% |
| D30 retention | 0.2-0.25% | 0.7-0.9% | ~2% | 10-16% |
| Session length | ~18 min | >30 min | >50 min | >100 min |
| Daily playtime | 32-33 min | ~70 min | >120 min | 300+ min |
| DAU/MAU | ~4-5% | ~7% | ~13-15% | often >50% |
Warning: mobile retention rules of thumb don't apply here
The mobile "40/20/10" heuristic for D1/D7/D30 sits roughly an order of magnitude above this PC population's actual medians. That's not a red flag for premium PC games; finite titles don't create the daily habit the mobile heuristic assumes.
Key takeaways
- Steamworks reports store-side numbers well and nothing about install behavior or retention; close that gap with third-party telemetry
- Steam's Wishlist Data API (March 2026) and Sales & Activation are the authoritative sources for your own numbers, not third-party estimators
- Steam UTM attribution captures roughly 20 to 30% of real traffic; your real cost-per-wishlist is likely 2x to 4x lower than reported, so divide before judging a channel
- Calculate your own break-even cost per wishlist instead of chasing a universal CPW benchmark, none exists
- Free telemetry tiers (GameAnalytics, Unity, PostHog, Amplitude, Mixpanel) cover a full prelaunch stack; don't apply mobile retention benchmarks to a PC game
Stage 3: Read Your Prelaunch Signals
Two studios can both launch with 12,000 wishlists and see sales-to-wishlist ratios spanning 1.9% at the bottom decile to a 10.5% median, with outliers far above that. Where those wishlists came from explains the spread, not the total itself.
7. Decode Your Wishlist Velocity and Quality
For games with more than 25,000 wishlists (2024-2025 cohort), the median week-one sales-to-wishlist ratio is 0.15x, so 100,000 wishlists implies around 15,000 first-week sales. Restrict to games priced above $10 and the median drops to 0.10x. A separate, larger GameDiscoverCo dataset, a rolling two-year window, corroborates this independently: 0.15x for wishlists above 25,000, 0.14x excluding adult titles, roughly 0.10x above $10.
Key insight: this is sales-to-wishlist, not wishlist conversion
The ratio's numerator includes buyers who never wishlisted, so it systematically overstates how many wishlisters actually bought. Treat it as a forecasting prior, not a measurement of wishlister behavior.
The dispersion around that median is wide. An August to October 2024 sample of 120 to 150 qualifying releases a month (all wishlist sizes, which is why its median sits below the 25,000-plus cohort's 0.15x above) found a 10th-percentile ratio of 1.9%, a 25th percentile of 4.8%, and a median of 10.5%. The best and worst performers differ by 10 to 20 times. The most extreme outliers in that sample sold at over 200 times their expected rate, almost always viral co-op or social titles that broke out through word of mouth rather than paid marketing.
Read the shape of your wishlist graph, not just the number
A wishlist total doesn't say whether it came from a slow build or a single spike. One well-documented case shows why that matters: a wishlist total built mostly from a single Steam Festival appearance and a burst of unrelated social-media virality converted at a small fraction of the median rate, because most of the people who wishlisted during that spike never engaged with the game again.
The game launched with about 12,000 wishlists. They converted to about 300 launch-day sales and 1,000 to 1,500 lifetime, and only 900 people ever opened the launch notification email. As the developer put it in a postmortem:
"The vast majority of those wishlists that I got through the Festival and Steam's build up to launch were worthless and likely will never buy the game."
A vertical spike in a wishlist graph from a promotion signals low future conversion. Conversely, gradual organic growth signals higher conversion.
Steam Next Fest follows the same logic. Pre-fest wishlist count is the strongest predictor of in-fest performance measured so far (a Spearman rank correlation of 0.825, against 0.2 to 0.4 for most indie marketing correlations). Studios with under roughly 2,000 wishlists before the event see minimal algorithmic lift. June 2026's Next Fest drew a record 4,382 demos, up sharply from June 2025, so a "good" number from an older festival isn't a safe benchmark to carry forward.
Key insight: Next Fest multiplies momentum, it doesn't create it
68 to 88% of Next Fest wishlists come from people who never play the demo. The event amplifies existing traction rather than discovering new fans for a cold start.
8. Unify Your Fragmented Audience
Discord, email, and Steam wishlist counts are separate, overlapping populations, and you can't tell how much they overlap without a unified view. A studio with 5,000 Discord members, 2,000 email subscribers, and 8,000 Steam wishlists might have 12,000 unique people, or 6,000.
A single point of failure in one of these channels can cost more than it looks like it should. One documented case: a Steam bug, affecting fewer than 100 games since 2015, silently prevented the launch notification email from sending at all. The failure wasn't discovered until months after launch, by which point a large wishlist count had already converted far below what its size implied.
Depending entirely on Steam's own notification infrastructure is a single point of failure. An owned channel, an email list you control, is insurance against it.
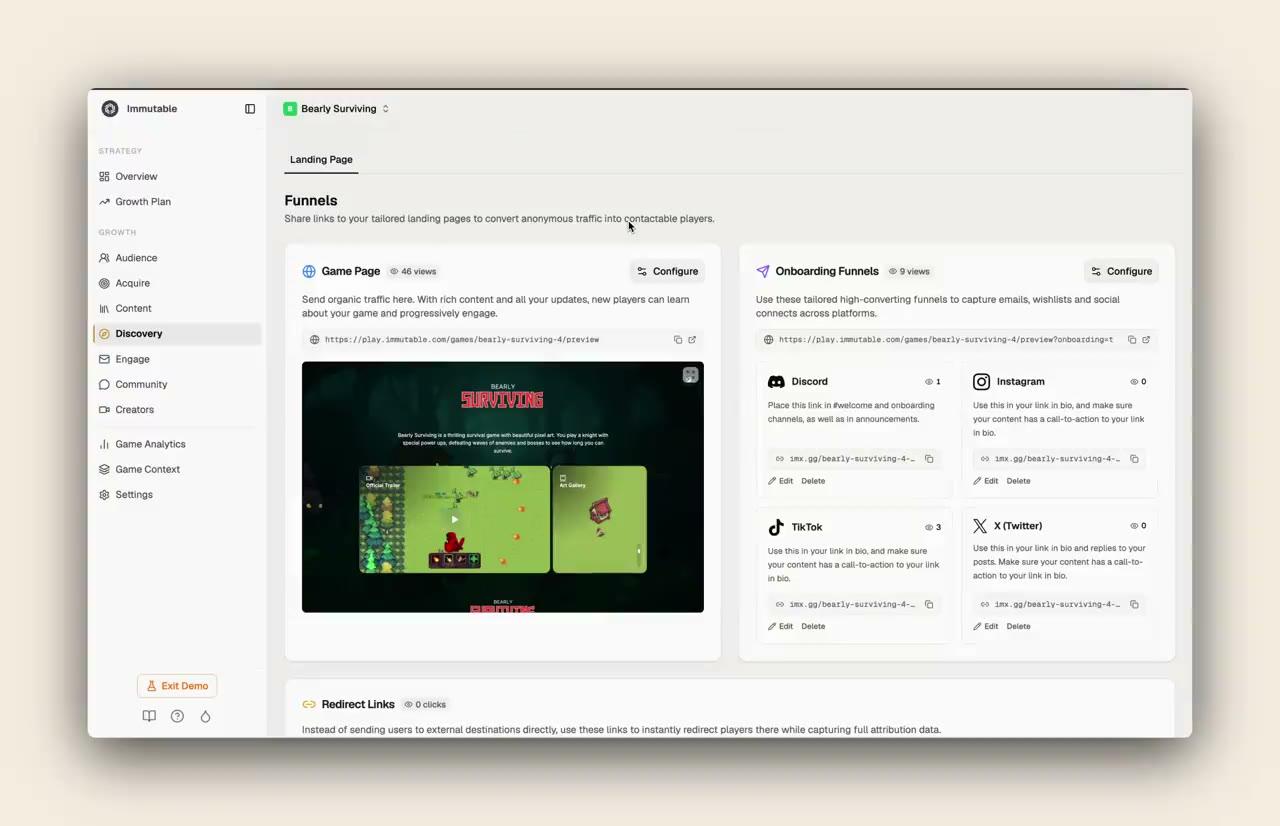
An owned audience compounds for studios with more than one game. Top-earning indie developers average 4 to 5 released titles against 1 to 2 for struggling studios. An owned, unified audience carries forward to the next launch instead of resetting to zero.
9. Your Launch Readiness Checklist
Before launch, confirm these seven things are actually true, not assumed:
- Wishlist velocity is tracked weekly, not just the total count
- Traffic source breakdown is reviewed: organic, paid, and social, separately
- Steam UTM cost-per-wishlist is divided by 2x to 4x (attribution undercounts) before you trust it
- Session and onboarding telemetry is live before the next public playtest
- First-time player completion rate is measured, and flagged if under 70%
- An owned channel, an email list, exists independent of Steam notifications
- Audience overlap across Discord, email, Steam, and Reddit is estimated or unified
Diagnose a weak number in order
When a number looks wrong, work through the funnel in sequence rather than guessing at the cause:
- High impressions, low visits: a capsule or placement problem. Segment by Steam origin and placement before touching the art
- Strong visits, weak wishlist rate: a page-promise mismatch. Test store messaging against a stable traffic mix
- High demo acquisition, low actual launches: acquisition friction or low intent. Track activation from acquisition to launch specifically
- High demo launches, early drop-off: an onboarding, crash, or pacing problem, usually locatable in the funnel's first 5 to 15 minutes
- Strong total wishlists, weak recent velocity: total demand can mask declining current interest. Plot wishlists by cohort and 7- and 28-day velocity, not the lifetime total
- Strong wishlists, weak launch sales: check wishlist age, source, price, reviews, and refunds before assuming the marketing failed; compare true wishlist-purchase data against the sales-to-wishlist ratio, since that ratio alone overstates the problem
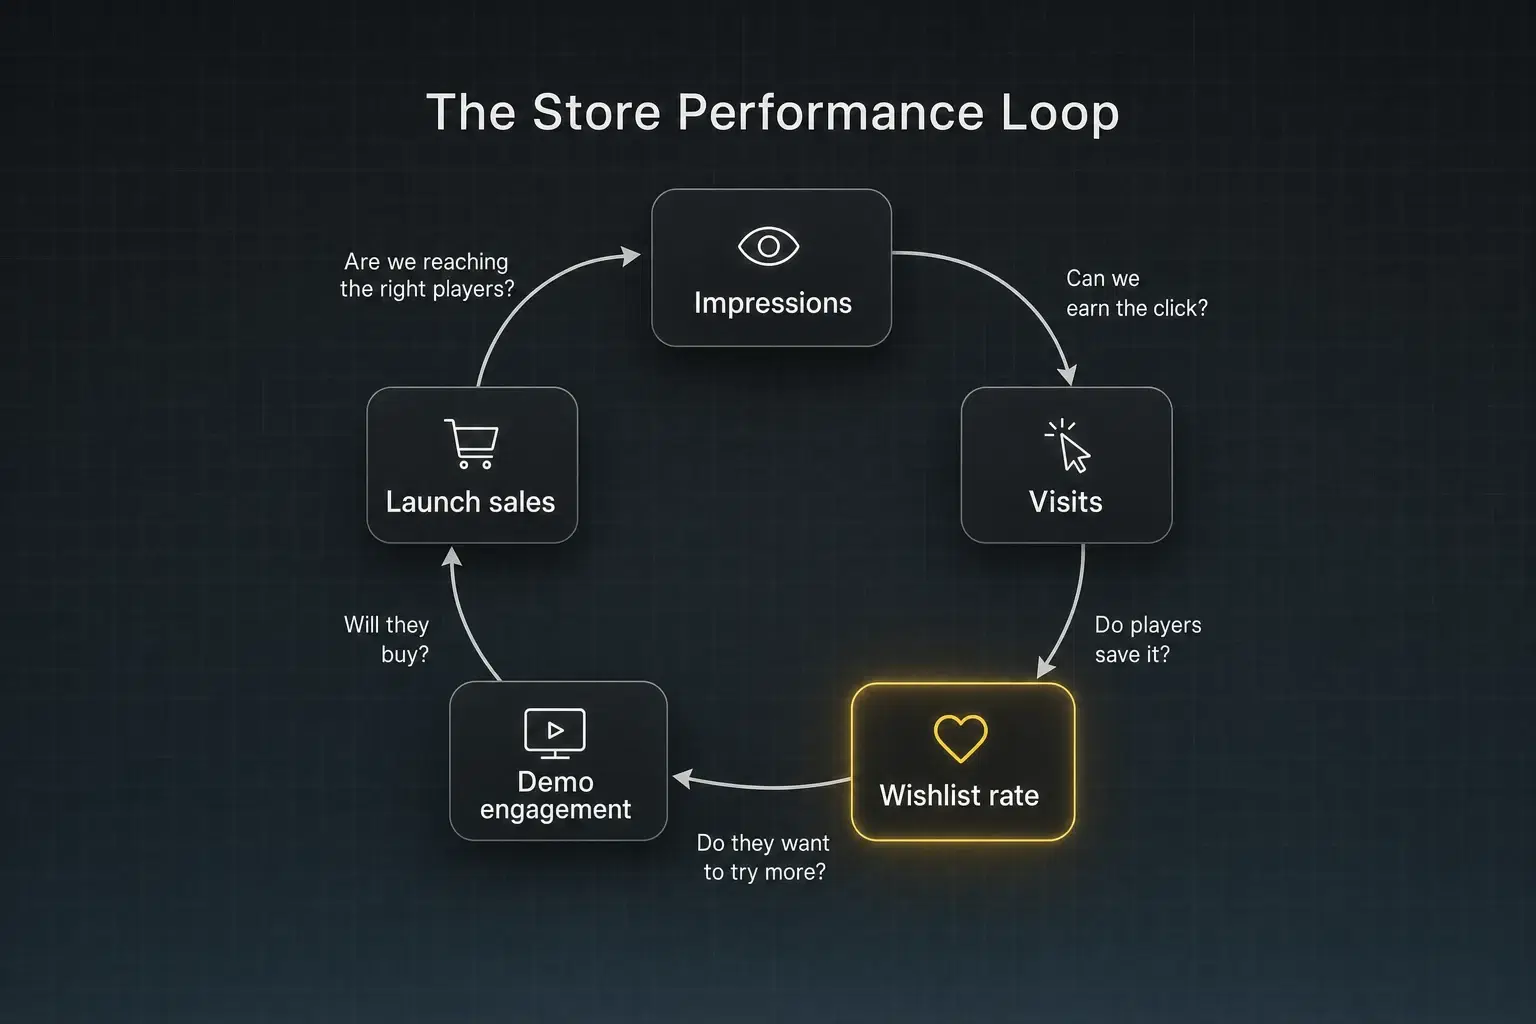
Key insight: fix in order, or you'll fix the wrong thing
Acquisition comes before positioning, positioning before product, product before scaling. Blaming a launch-sales miss on "the algorithm" skips every one of these steps and usually points at the wrong fix.
Key takeaways
- Sales-to-wishlist ratios (0.10 to 0.15x for larger lists) are forecasting priors, not a measurement of what wishlisters actually do
- A gradual wishlist build converts better than a promotional spike; check the shape of your graph, not just the total
- Steam Next Fest multiplies existing momentum; it rarely creates it from a cold start
- An owned channel protects against single points of failure like a missed Steam notification, and an audience unified across channels compounds across future launches
- When a number looks wrong, diagnose acquisition, then positioning, then product, then scale, in that order
Find out which numbers are actually driving your next launch
Immutable's Conversion Funnel and Engage close the same gap this guide covers: an owned, attributable audience across Steam, email, and Discord. Ubisoft used both to lift Day 1 player conversion 2.8x on Might & Magic: Fates.
Conclusion
I hope this changes how you watch your numbers before launch. Still, there's no single metric that guarantees a good launch, and plenty of good games still get unlucky. But the studios I see consistently outperform their wishlist count are the ones tracking velocity instead of totals, closing the gap in what Steamworks shows them, and owning at least one channel Steam doesn't control. Do those three things, and you'll know where you actually stand well before launch day, not after.
Robbie Ferguson, Co-Founder and President at Immutable
P.S. If closing that gap sounds like a lot to build yourself, it's close to exactly what Immutable's Conversion Funnel and Engage do together: capture the audience Steam can't reach on its own, then convert it. Ubisoft used both to lift Day 1 conversion from 2.37% to 6.64%, a 2.8x increase, on Might & Magic: Fates. Book a demo to see what that could look like for your next launch.
Free analytics review
Find out which of your numbers actually predict a good launch
We'll review your wishlist velocity, page conversion, and traffic source quality against our dataset from 800+ games, and walk you through the highest-impact fixes on a 30 minute call.
Get my free analytics review★★★★★ Trusted by Ubisoft, Netmarble, and 800+ studios
This content is meant to inform and educate; it's not a substitute for advice tailored to your specific circumstances. Always evaluate options in the context of your own goals, constraints, and (where relevant) professional guidance. While care has been taken in the preparation of this guide, no guarantees are made as to its accuracy, completeness, currency or that it will be error-free.